Electro-Chemical Reaction Visualizing Confocal System
ECCS B320
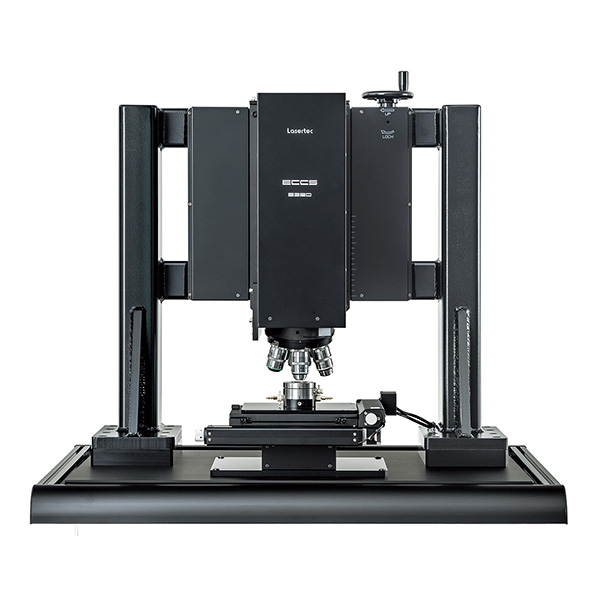
Operand observation of a lithium-ion battery is achieved.
Topics
Product outline
- Observation of cross-sectional electrode during charging and discharging.
- The reaction distribution in the thickness direction of the electrodes can be analyzed individually.
- Measure the amount of expansion and contraction of the electrode.
- Visualize the dendrite generation process.
Applications
| Overall battery performance |
|
|---|---|
| Anode |
|
| Cathode |
|
| Electrolyte |
|
| Conductive additives |
|
| Binder |
|
| Separator |
|
Options
- Observation cell
- Temperature control (-30℃~80℃)
- Others
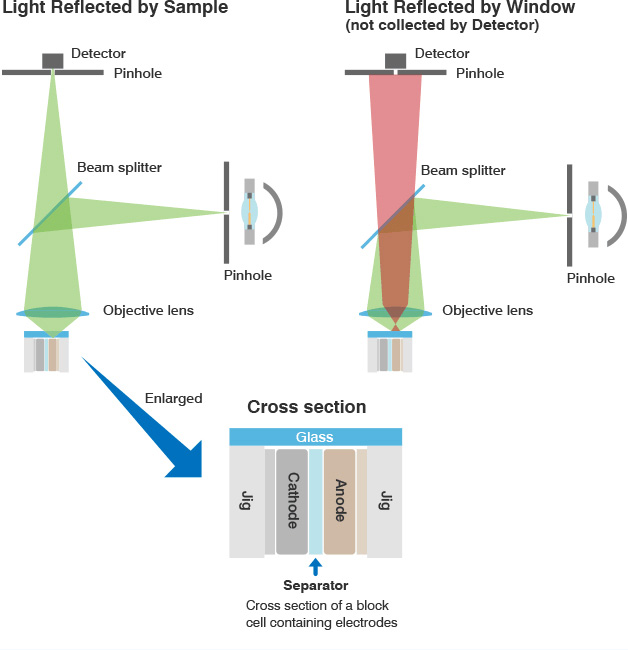
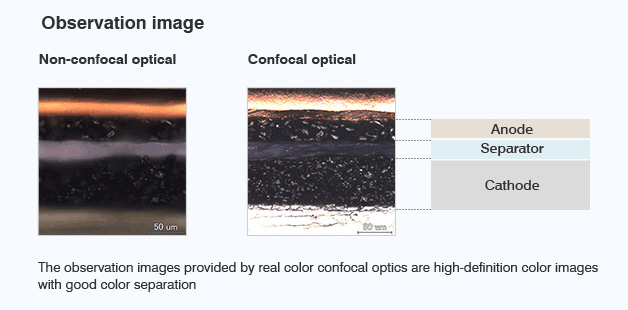
Real-color confocal optics
- Real-color confocal optics is designed to collect reflected light from the focal plane (the surface of active materials on electrode) without being affected by the glass surface or electrolyte, providing high-resolution color images with good color separation.
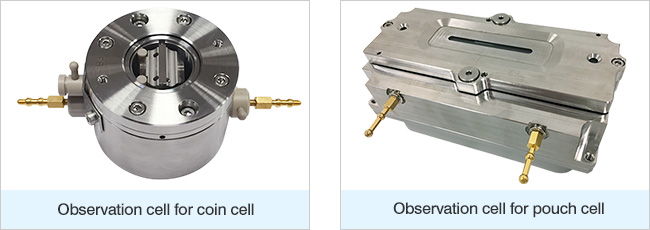
Observation cell
The following specially-designed observation cells are available for in-situ observation:
- Observation cell for coin cell
- Basic model compatible with coin-shaped electrodes
- Observation cell for pouch cell
- Advanced model compatible with stacked batteries, etc.
Temperature control system
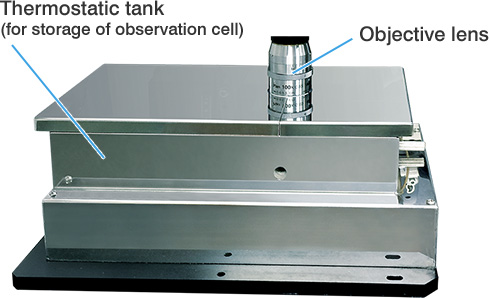
- Specially-designed thermostatic tank that can store the observation cell
- The inside of thermostatic tank is kept dry to prevent condensation.
- Range of temperature control: -30℃~80℃
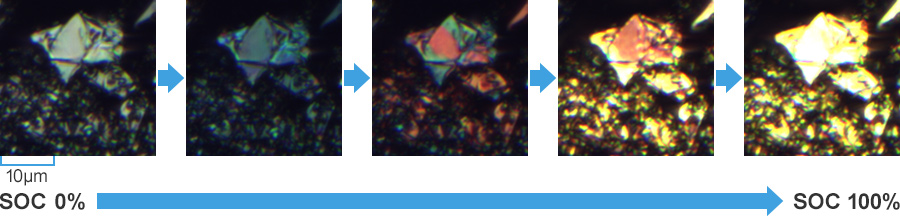
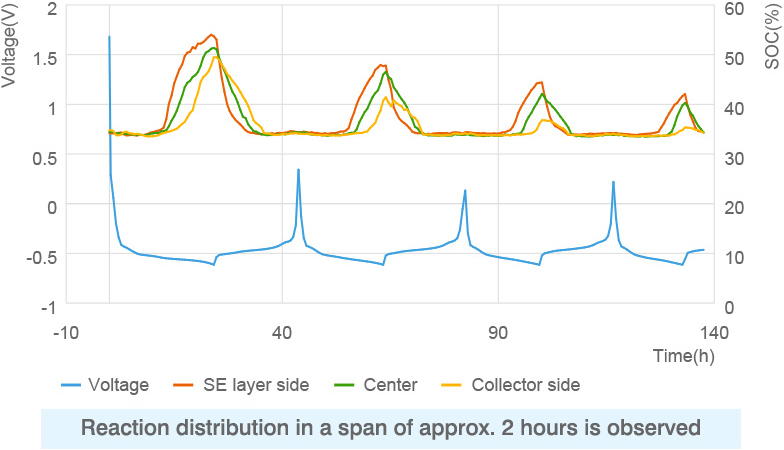
Analysis of electrochemical reaction distribution
Anode
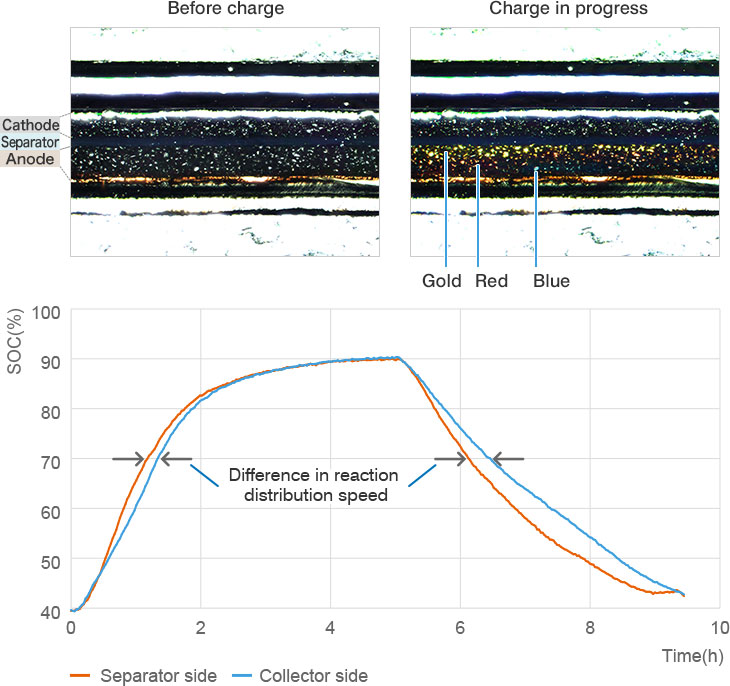
The graphite anode goes through several different stages during charge and reaches SOC100% when the intercalation of lithium ions occurs between all layers.
In the process, the color of active materials changes from grey to blue, red and finally gold. From these colors, you can analyze the electrochemical reaction distribution quantitatively.
Intercalation of lithium ions in graphite anode
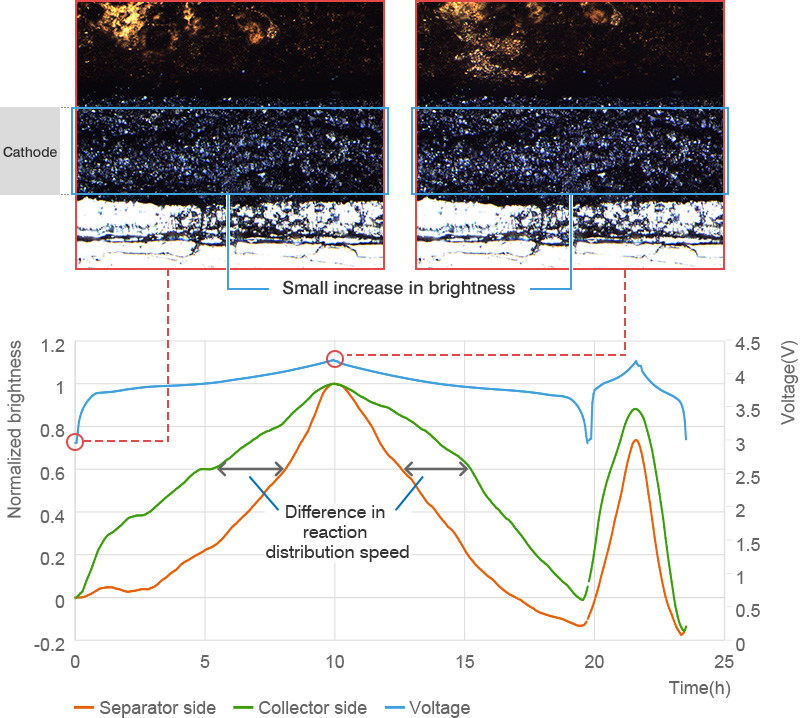
Cathode
The change of color seen in graphite anodes will not usually occur in cathodes, but you can quantitatively analyze the reaction distribution in cathodes by measuring small changes in brightness during charge/discharge.
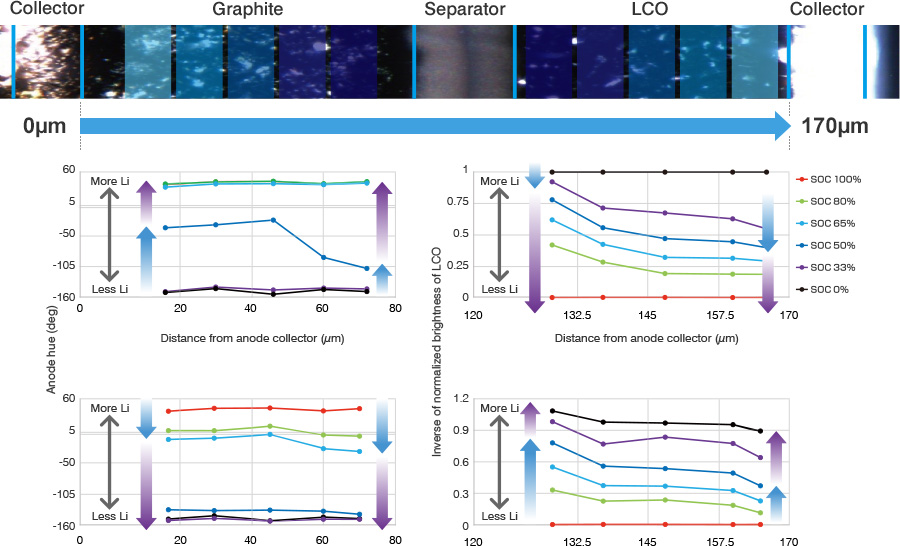
Simultaneous analysis of reaction distribution in both cathode and anode
From presentation at Battery Symposium in Japan 2017 (2A14)
The analysis of reaction distribution for both cathode and anode is possible at the same time-the former based on change in brightness and the latter based on change in hue.
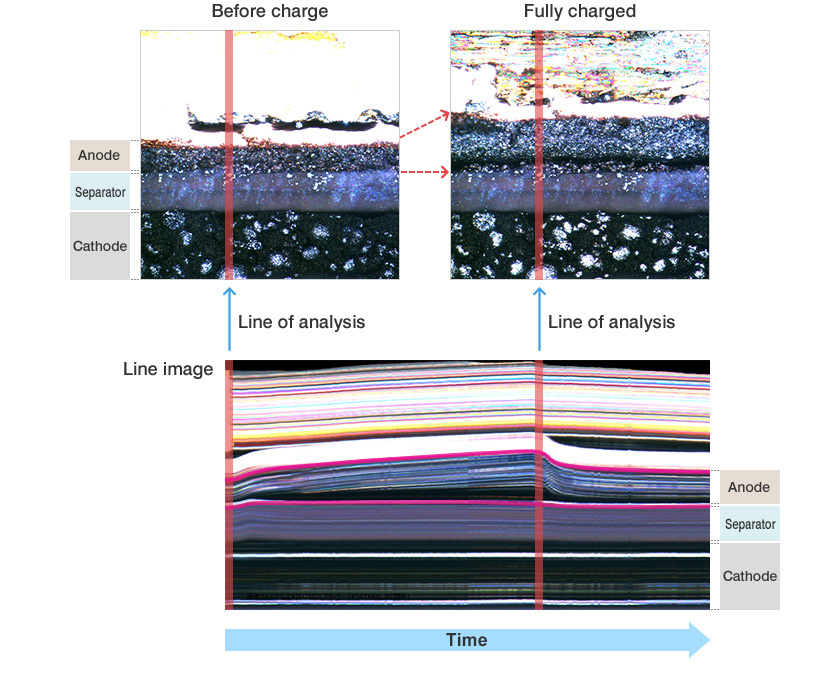
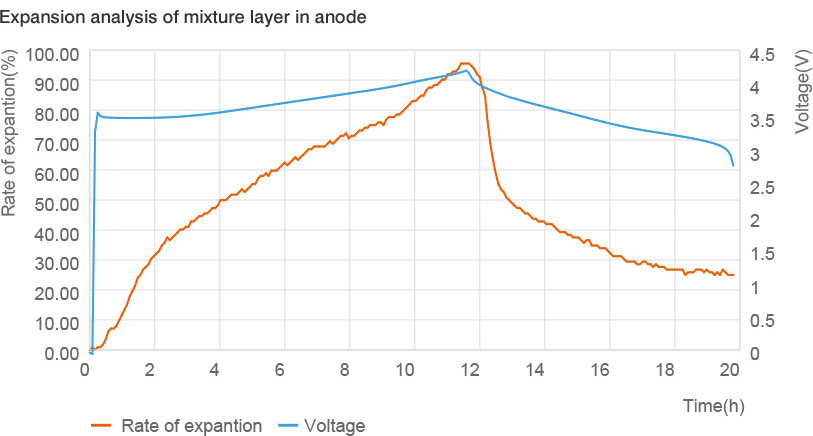
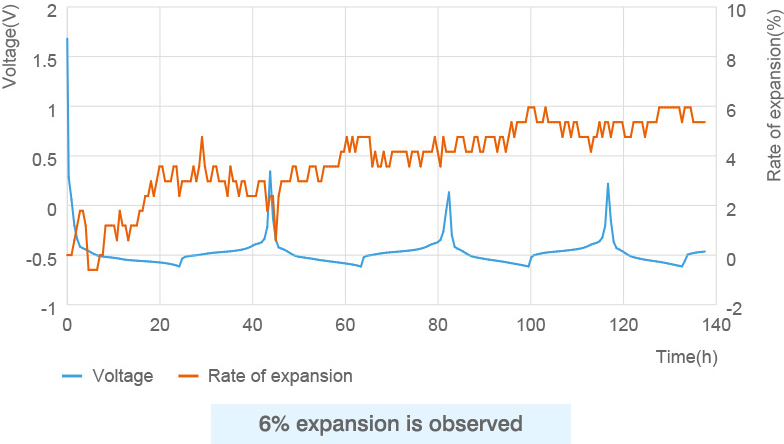
Analysis of expansions and contractions
The expansion/contraction analysis using ECCS enables small-change measurement and real-time analysis, neither of which is possible with a micrometer or displacement gauge. ECCS can create a "line image" by slicing a captured image at a user-specified line of analysis and by aligning successive sliced images in a chronological order. You can select a mixture layer and conduct measurement on the line image.
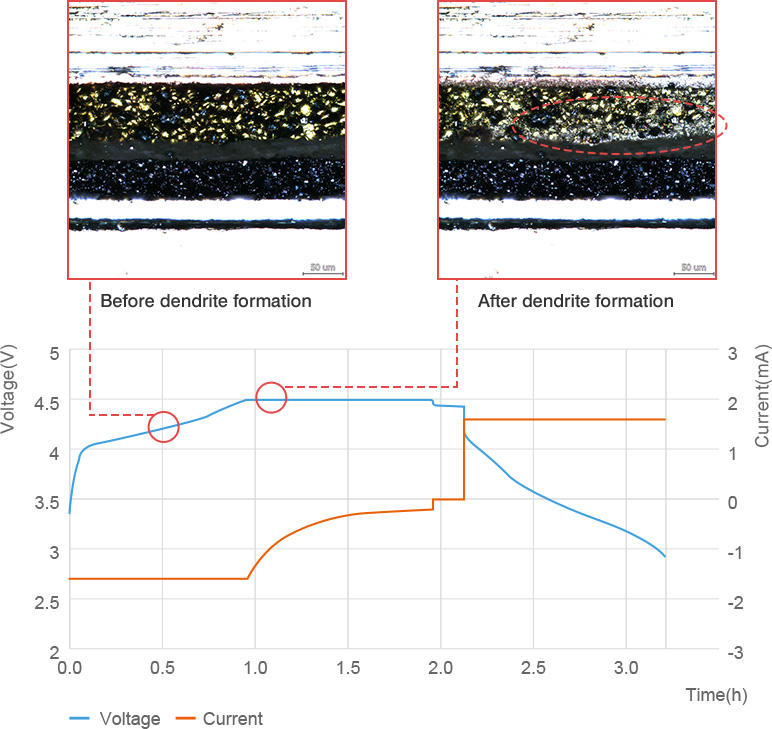
Observation of dendrite formation
- Evaluation of dendrite formation mechanism
- ECCS enables the observation of small dendrite formations that are not visible in the charge/discharge curves of batteries.
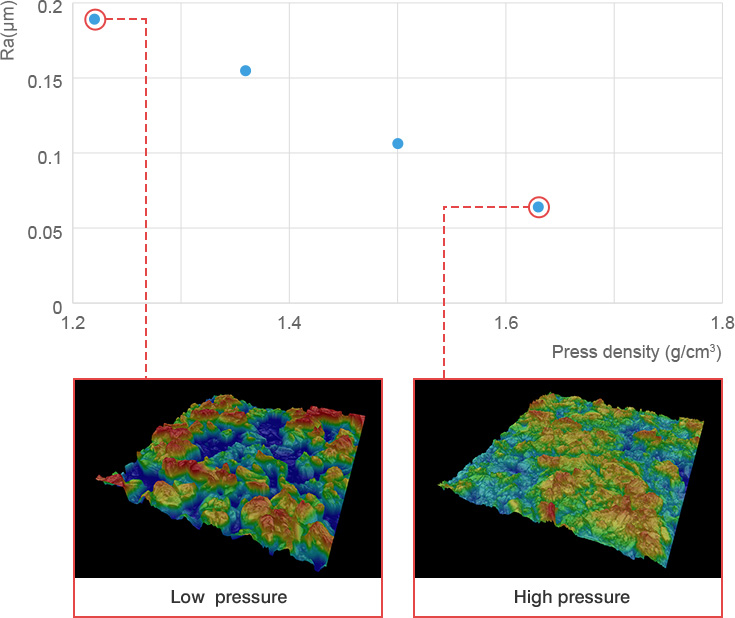
Measurement of voidage in electrode
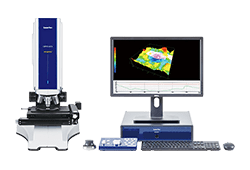
ECCS B320 has a microscope function that can be used to measure the surface roughness and voidage of electrode.
Solid state battery (sample by Prof. Hayashi, Osaka Prefecture University)
- *Click the screen to watch the video.
- *This is a fast-forwarded replay.
| Working electrode | Graphite : SE = 50 : 50 (wt.%) |
|---|---|
| Counter electrode | Li-In |
| Solid state electrolyte | Li2S·P2S5 |
|---|---|
| C-rate | 0.03C |
Reaction distribution analysis
Expansion/contraction analysis
Stacked battery
The newly released laminated cell can be used for analysis of double-side-coated electrodes and Stacked battery.
- *Click the screen to watch the video.
- *This is a fast-forwarded replay.
Graphite
High magnification
ECCS B320 provides high-magnification color images and supports the analysis of electrochemical reactions of an active material.
- *Click the screen to watch the video.
- *This is a fast-forwarded replay.
| Working electrode | Spheroidal graphite |
|---|---|
| Counter electrode | Li |
| Charge rate | 0.3C |
|---|---|
| Cell | Block cell for cross-sectional observation |
Reaction distributions
ECCS B320 shows dendrites being formed by current concentration as a result of uneven reactions during the charging process.
- *Click the screen to watch the video.
- *This is a fast-forwarded replay.
| Anode | Artificial graphite |
|---|---|
| Cathode | NCM |
Silicon anode
ECCS B320 visualizes the volumetric expansion of active materials and enables you to measure the thickness of active materials for analysis and comparison with the battery's charge/discharge curves.
- *Click the screen to watch the video.
- *This is a fast-forwarded replay.
| Anode | Si |
|---|---|
| Cathode | NCA |
Dendrite
ECCS B320 shows dendrites being formed while a battery is overcharged at high rate. Once the charging stops, the dendrites start to shrink and lithium ions are dispersed from dendrites to charge the anode.
- *Click the screen to watch the video.
- *This is a fast-forwarded replay.
| Anode | Spheroidal graphite |
|---|---|
| Cathode | NCM |
| Charge rate | 4C |
|---|---|
| Cell | Block cell for cross-sectional observation |
LCO
ECCS can capture small changes in brightness during charge/discharge and enables you to make quantitative analysis of the reaction distribution in the cross section of cathodes in the same way you do for anodes.
- *Click the screen to watch the video.
- *This is a fast-forwarded replay.
NMC
ECCS can capture very small expansions and contractions in cathodes, which usually show only a slight dynamic change.
- *Click the screen to watch the video.
- *This is a fast-forwarded replay.
Outgassing
ECCS enables the observation of outgassing during charge/discharge.
In-situ gas analysis is also available when a gas analysis cell is used (together with a gas chromatograph).
- *Click the screen to watch the video.
- *This is a fast-forwarded replay.
You might also be interested in