Principle of confocal microscope
Confocal optics
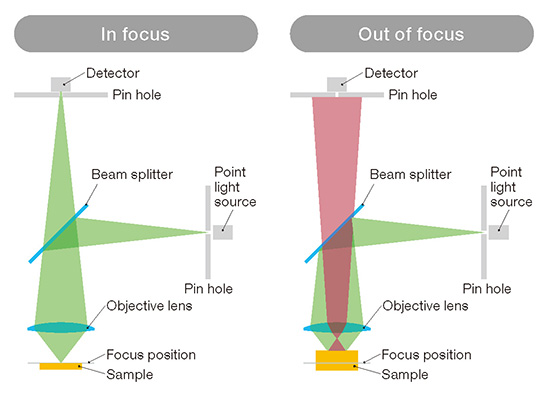
The principle of confocal optics is as follows. The light beams emitted by the light source pass through a lens and focus at the surface of the sample. The light beams reflected by the sample pass through the same lens again from the opposite direction and are routed towards the photodetector. The photodetector detects only the light beams that form a sharp focus and pass the pinhole that is placed right in front of it. The name, confocal, comes from the fact that there are two focal points, one at the sample surface and the other at the photodetector. Only the beams forming a focus at the sample form a second focus at the photodetector and reach there. Other beams do not reach the photodetector. In other words, confocal optics are the optics that detect only the reflected light from the focal plane. A microscope using confocal optics is called a confocal microscope.
Features of confocal optics
1. High resolution and high contrast
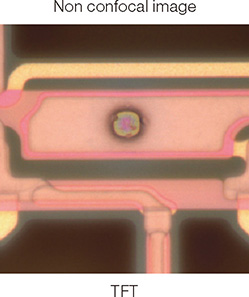
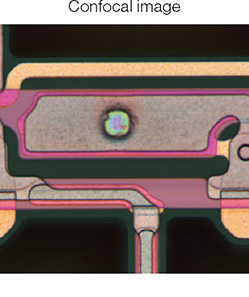
Confocal optics provide superior lateral resolution and contrast compared with non-confocal optics (ordinary microscope optics). By using confocal optics, you can eliminate scattered light from outside the focal plane and obtain a clearly focused image with high resolution and high contrast free from the effect of unnecessary stray beams. In general, confocal optics provide about 30% better lateral resolution than ordinary optics. Shown below are images of a thin film transistor (TFT) captured with confocal optics and ordinary optics. Confocal optics provide an image that clearly shows the small pattern of TFT without blurs, whereas the non-confocal image is focused but with lower resolution.
2. High longitudinal resolution (high resolution in Z direction)
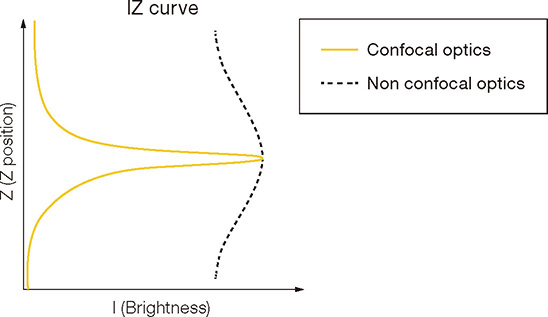
Confocal optics form an image using only the reflected light from the focal plane, achieving high longitudinal resolution in the Z direction. The image provided by confocal optics has extremely shallow depth of focus (optical sectioning effect).
As shown below, the shape of IZ curve differs greatly between confocal optics and non-confocal optics. The shape of IZ curve is determined by the wavelength of incident light and the NA of the objective lens. The IZ curve becomes steeper as the wavelength gets shorter or as NA increases.
Measurement by confocal microscope
A confocal microscope can provide an all-in-focus image with height information by performing a focus scan.
1. Focus scan
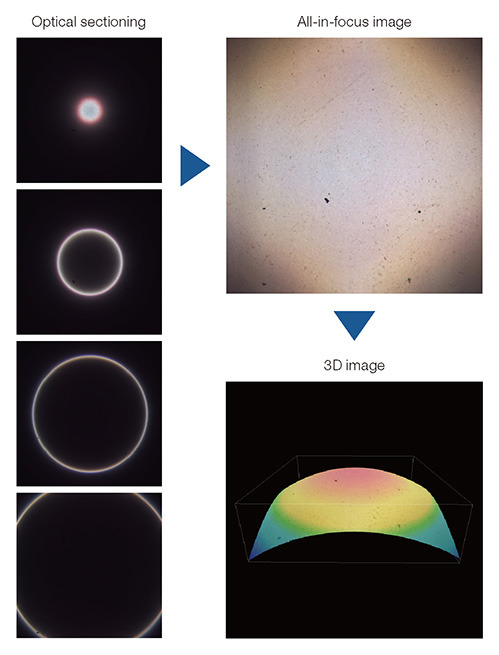
In a focus scan, a confocal microscope captures multiple images with shallow depth of focus at different locations by continously moving the sample in the Z direction (the images captured in this manner are called "optical sectioning images"). While doing it, the confocal microscope records the peak brightness and its location where focus is achieved for each image. The images shown below are optical sectioning images of a sphere captured in a focus scan.
2. All-in-focus image
A confocal microscope can create an all-in-focus image by picking the peak brightness area of each image captured in a focus scan and integrating all the peak areas from multiple images into a single image. The result is an image with high resolution and shallow depth of focus at all points in the field of view. In other words, an all-in-focus image is created by joining all the optical sectioning images captured in a focus scan.
3. Height measurement
You can obtain height information from the position of peak brightness for each pixel. By integrating all the height information from multiple pixels into a single image, you get an image with the height information of all points in the field of view. This image is called a height image. By analyzing the height image, you can perform various 3D measurement. You can also create a 3D image.
4. Peak detection method
To obtain the position of peak brightness in IZ curve accurately, you need to set the Z step of focus scan (the distance the stage moves along the Z direction in one scan) correctly. Various methods are proposed to increase the accuracy of the detection of peak position, including interpolation of IZ curve, to improve height resolution. As a method of peak detection, there are several methods. Examples include the detection of maximum brightness values and the fitting of IZ curve with a quadratic equation.
You might also be interested in